Simulating Social Distancing with D3
With stay at home orders being imposed here in California and having some extra time I wanted to play around with D3 and (a completely unscientific) simulation how it would change the outcome to the Covid-19 epidemic.
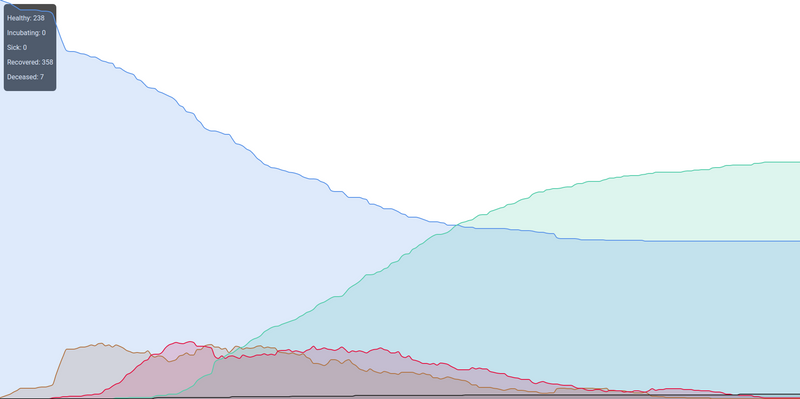
It as well posed some challenges with calculating bouncing of 'persons' symbolized by colorful balls. You can see the result here. While it doesn't do any realistic simulation it's still giving you an idea what happens when 50% of the population stay in place (not much change in outcome, just some slowing down), how the timing of 'stay at home' influences the outcome etc. You can influence behavior in the top right corner. Once the 'simulation' runs it course and everybody either got spared, got sick and recovered or died there is a graph showing the outcome.
The repo is here
The 'person' type looks like this:
export interface IPerson {
  x: number
  y: number
  r: number
  vx: number
  vy: number
  speed: number
  key: number
  status: Status
  infected: number | null
  incubation_time: number | null
  recovery_time: number | null
  infection(): void
  move(percentage: number): void
  checkStatus(): void
  draw(): void
}